Scientific Drawing
Overview
The Scientific Drawing module provides professional visualization drawing capabilities for research scenarios, covering academic charts commonly used such as flowcharts, technical roadmaps, Venn diagrams, honeycomb charts, and split comparison charts. It supports creating blank drawings, reusing public template libraries, online drag-and-drop editing, AI-assisted drawing, classified retrieval and collection, permission sharing and file management. It can generate standardized scientific illustrations suitable for papers, reports and project applications, realizing a complete visualization workflow from template selection, online editing to export and sharing.
Applicable Roles
- Individual Research User: Possess full permissions to create, edit, collect, share and delete self-owned drawings; able to browse templates in the public resource library and collect them for reuse.
- Ordinary Team Member: Can view team-shared drawings, only have preview and usage permissions without editing or deleting permissions.
- Drawing Creator: Full management permissions for drawings, including online editing, AI generation, sharing permission configuration and drawing deletion.
- Team Administrator: Uniformly manage team-shared drawings and control drawing sharing permissions of the whole team.
Core Functions
- Drawing Resource Classification View: Five classification panels including Resource Library, Recent Visited, Mine, Shared With Me and My Collections;
- Public Template Resource Library: Multi-disciplinary template retrieval, discipline tag filtering, template preview / one-click use and template collection;
- Drawing Lifecycle Management: Create blank drawings, preview / delete personal drawings and collect drawings;
- Online Visual Editor: Drag and drop multi-type graphic materials (basic shapes, connecting lines, flowcharts, class diagrams, sequence diagrams) to build canvases;
- Drawing Auxiliary Tools: AI drawing assistance, quick template application, canvas zoom / undo / brush / eraser and other editing toolbars;
- Drawing Sharing Permission Control: Configure access permissions, access passwords and sharing validity periods, and generate share links;
- Retrieval & Filtering: Global keyword retrieval for drawings, filter templates by discipline categories (Engineering / Medicine / Economics, etc.).
Operation Guide
Access the Scientific Drawing Module
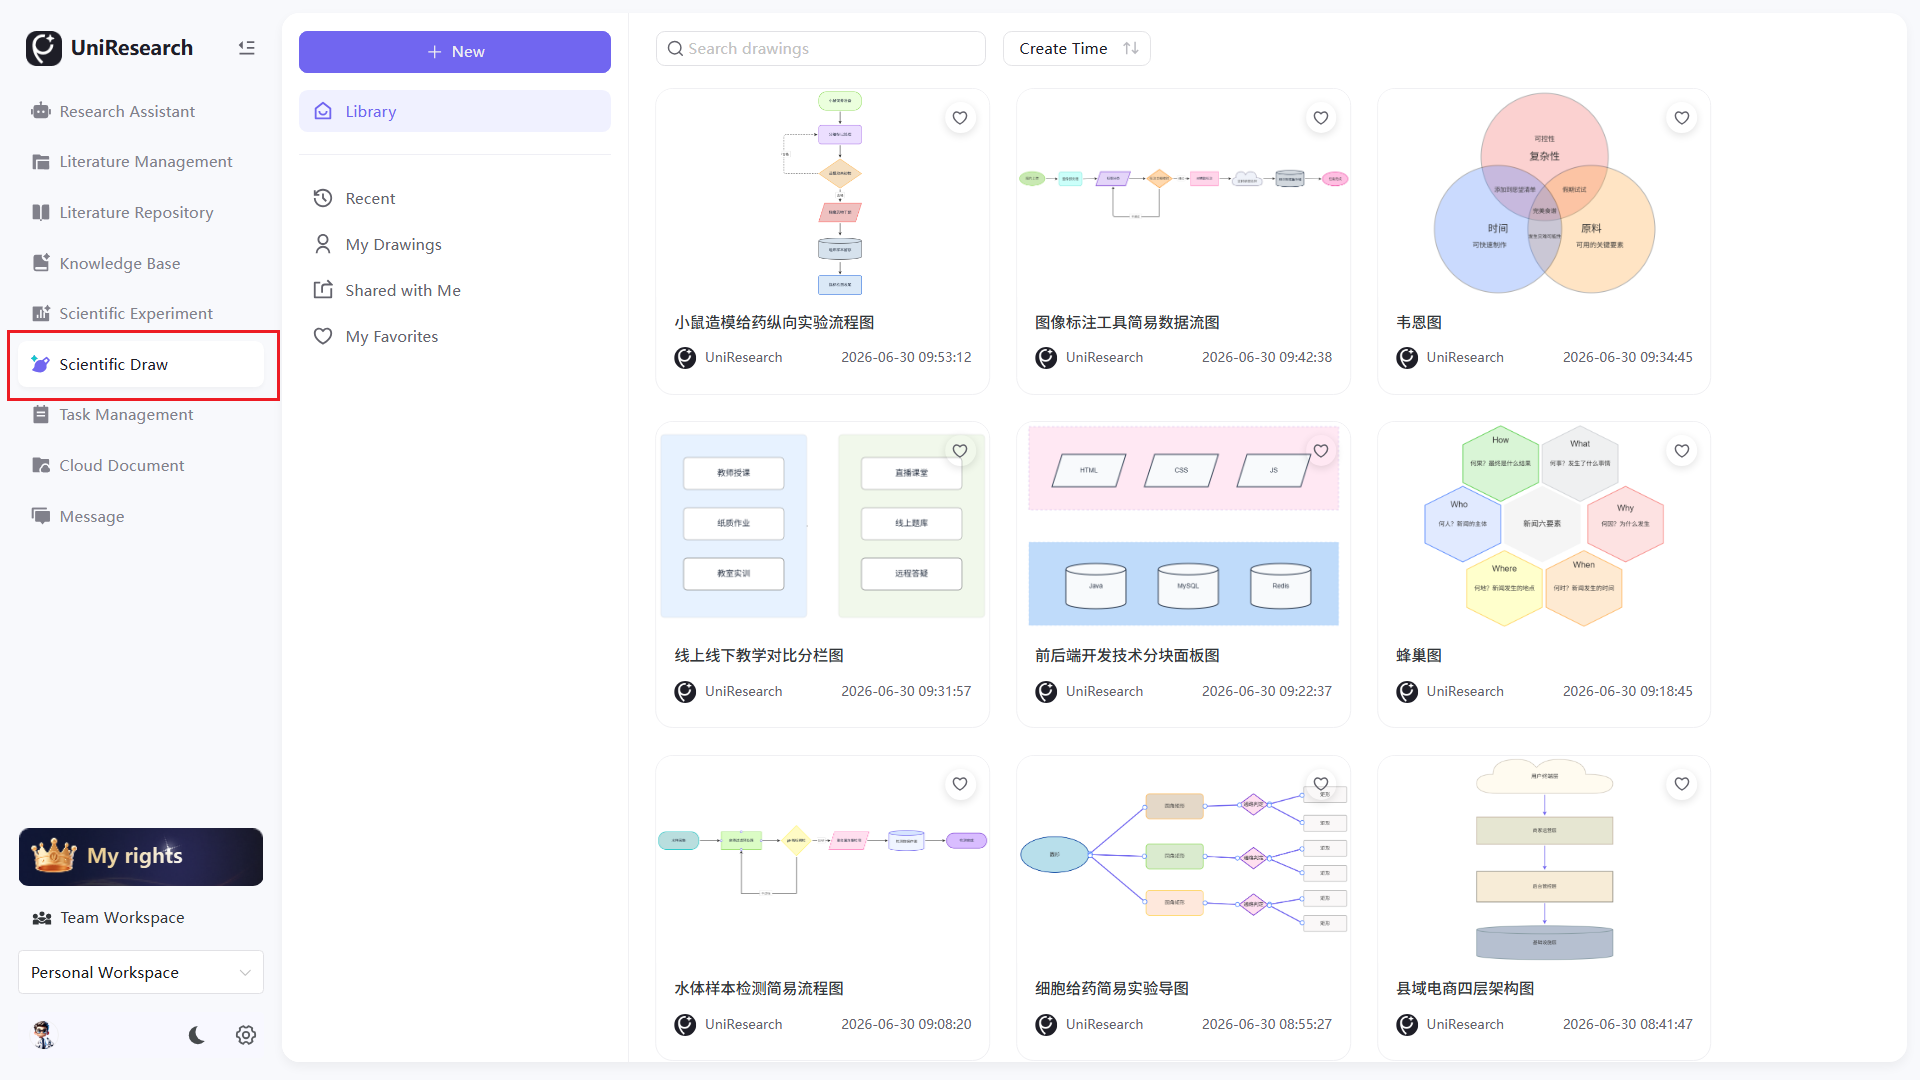
Click Scientific Drawing on the left navigation bar, and the page defaults to the public template page of the Resource Library.
Use Templates in Public Resource Library
- Enter chart name keywords in the top search box to retrieve corresponding templates;
- Filter by discipline tags: All, Presentation Report, Engineering, Philosophy, Economics, Law, Education, Literature, History, Science, Agriculture, Medicine, Art, Business & Management;
- Operations on template cards:
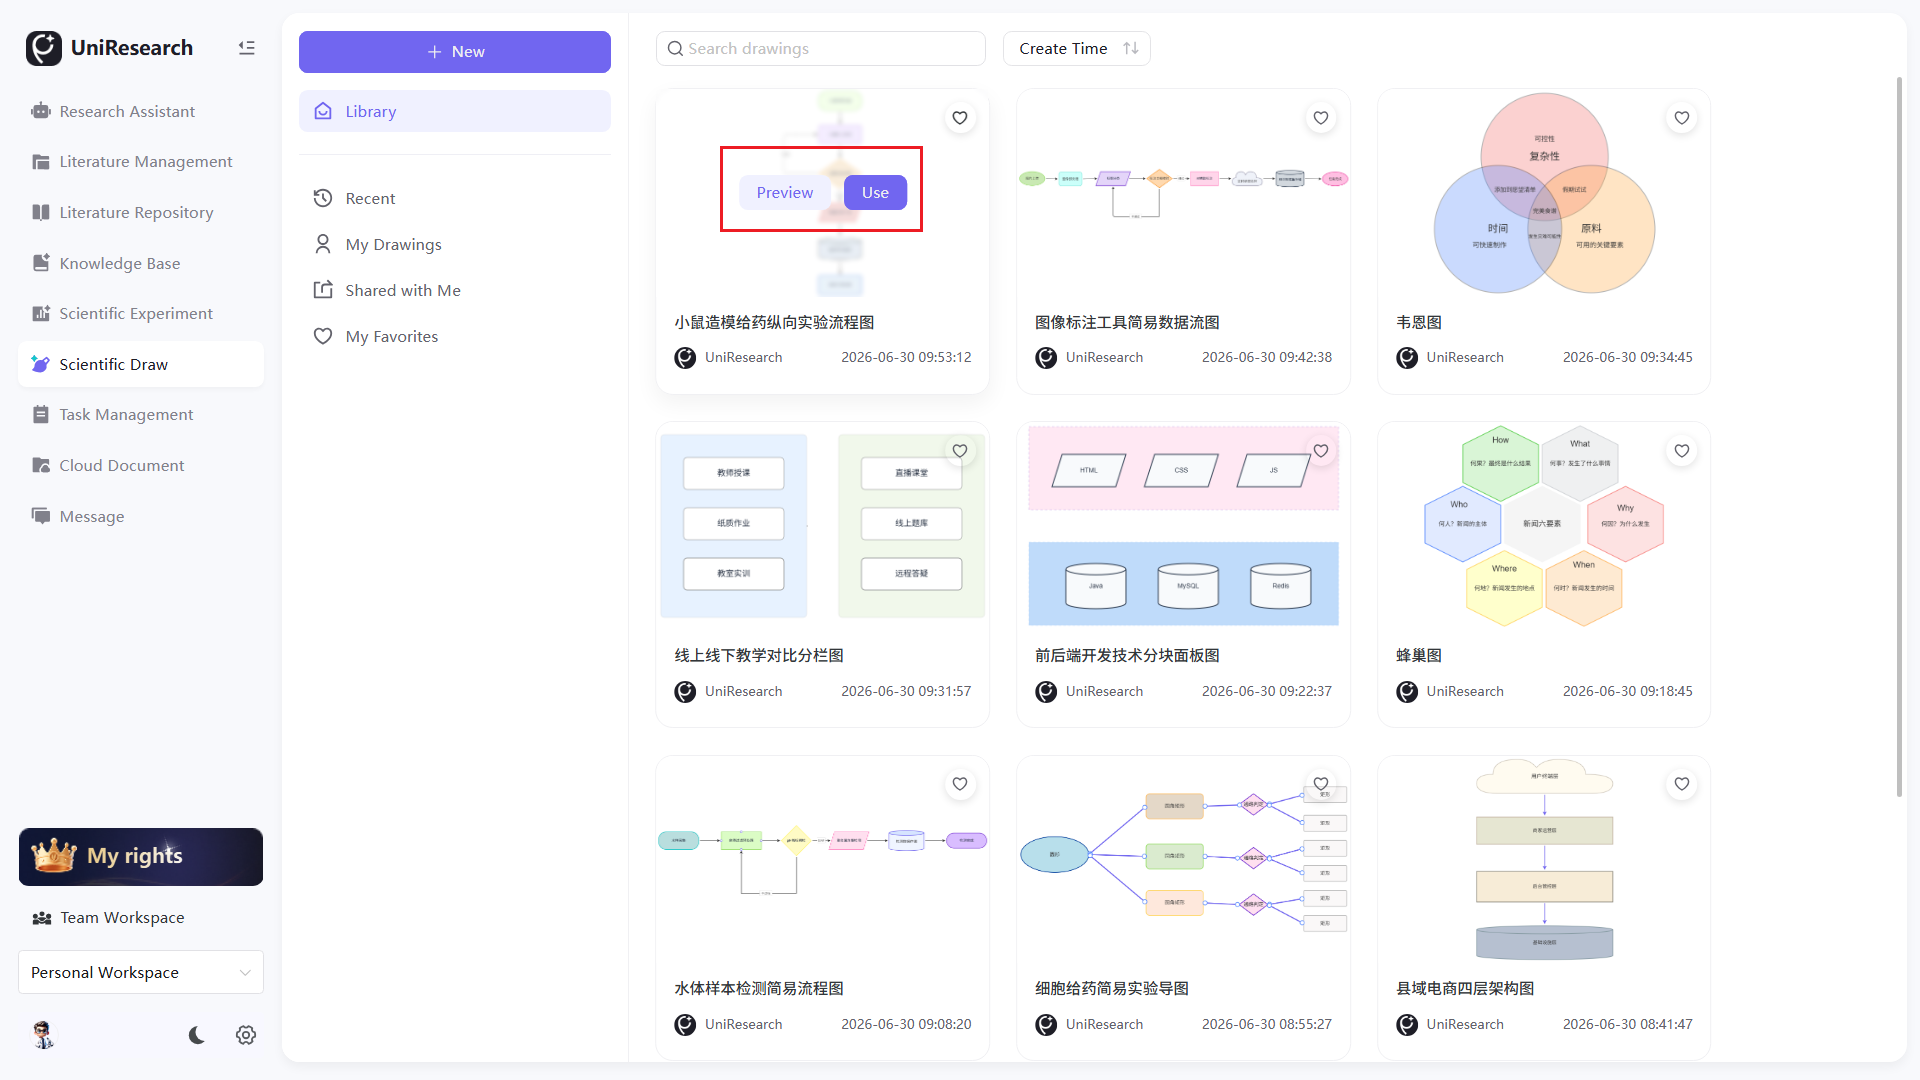
- Preview: Pop up a window to view the complete chart style;
- Use: Copy the template to the Mine directory and enter the editor to modify content;
- Heart-shaped Collect: Add the template to the My Collections category for quick reuse.
Switch Left Classification Panels
- Resource Library: Public academic drawing templates of the whole platform, supporting preview, one-click copy for use and collection;
- Recent Visited: Records recently opened / edited drawings for rapid secondary editing;
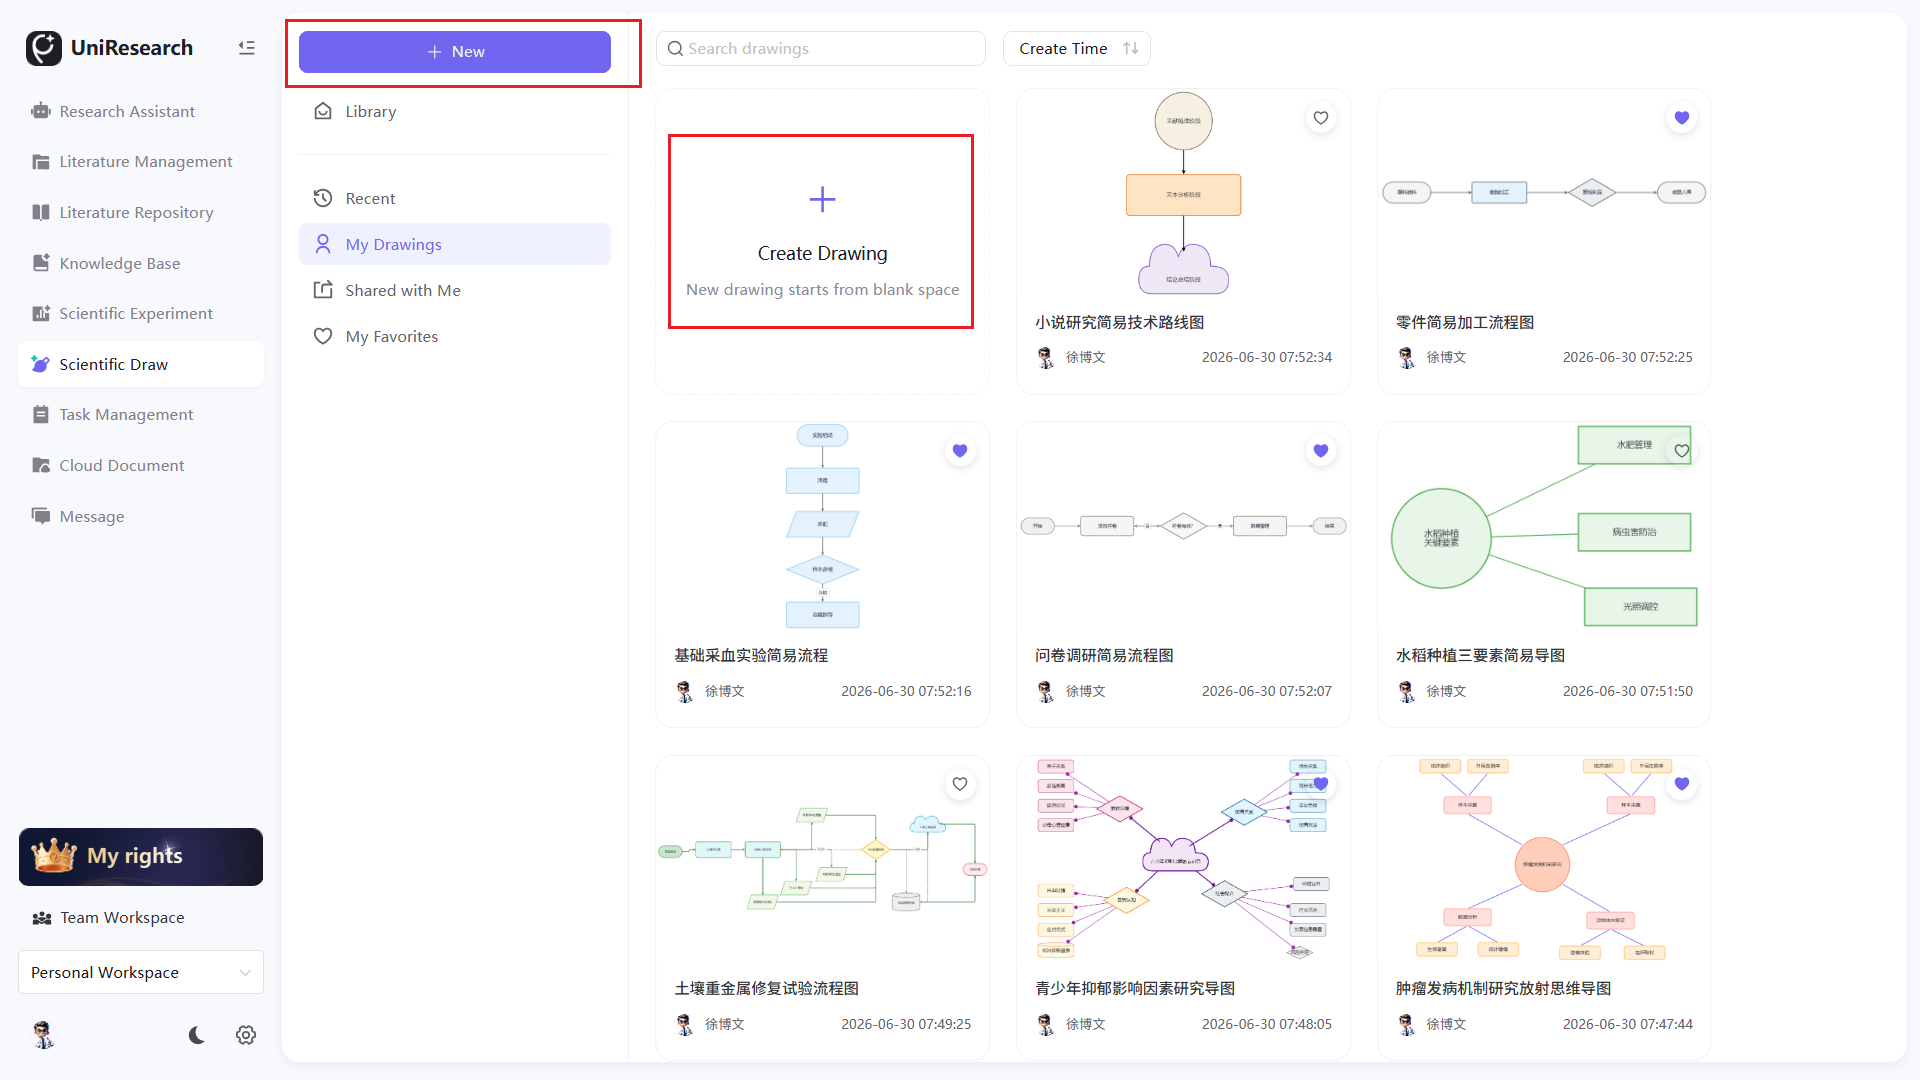
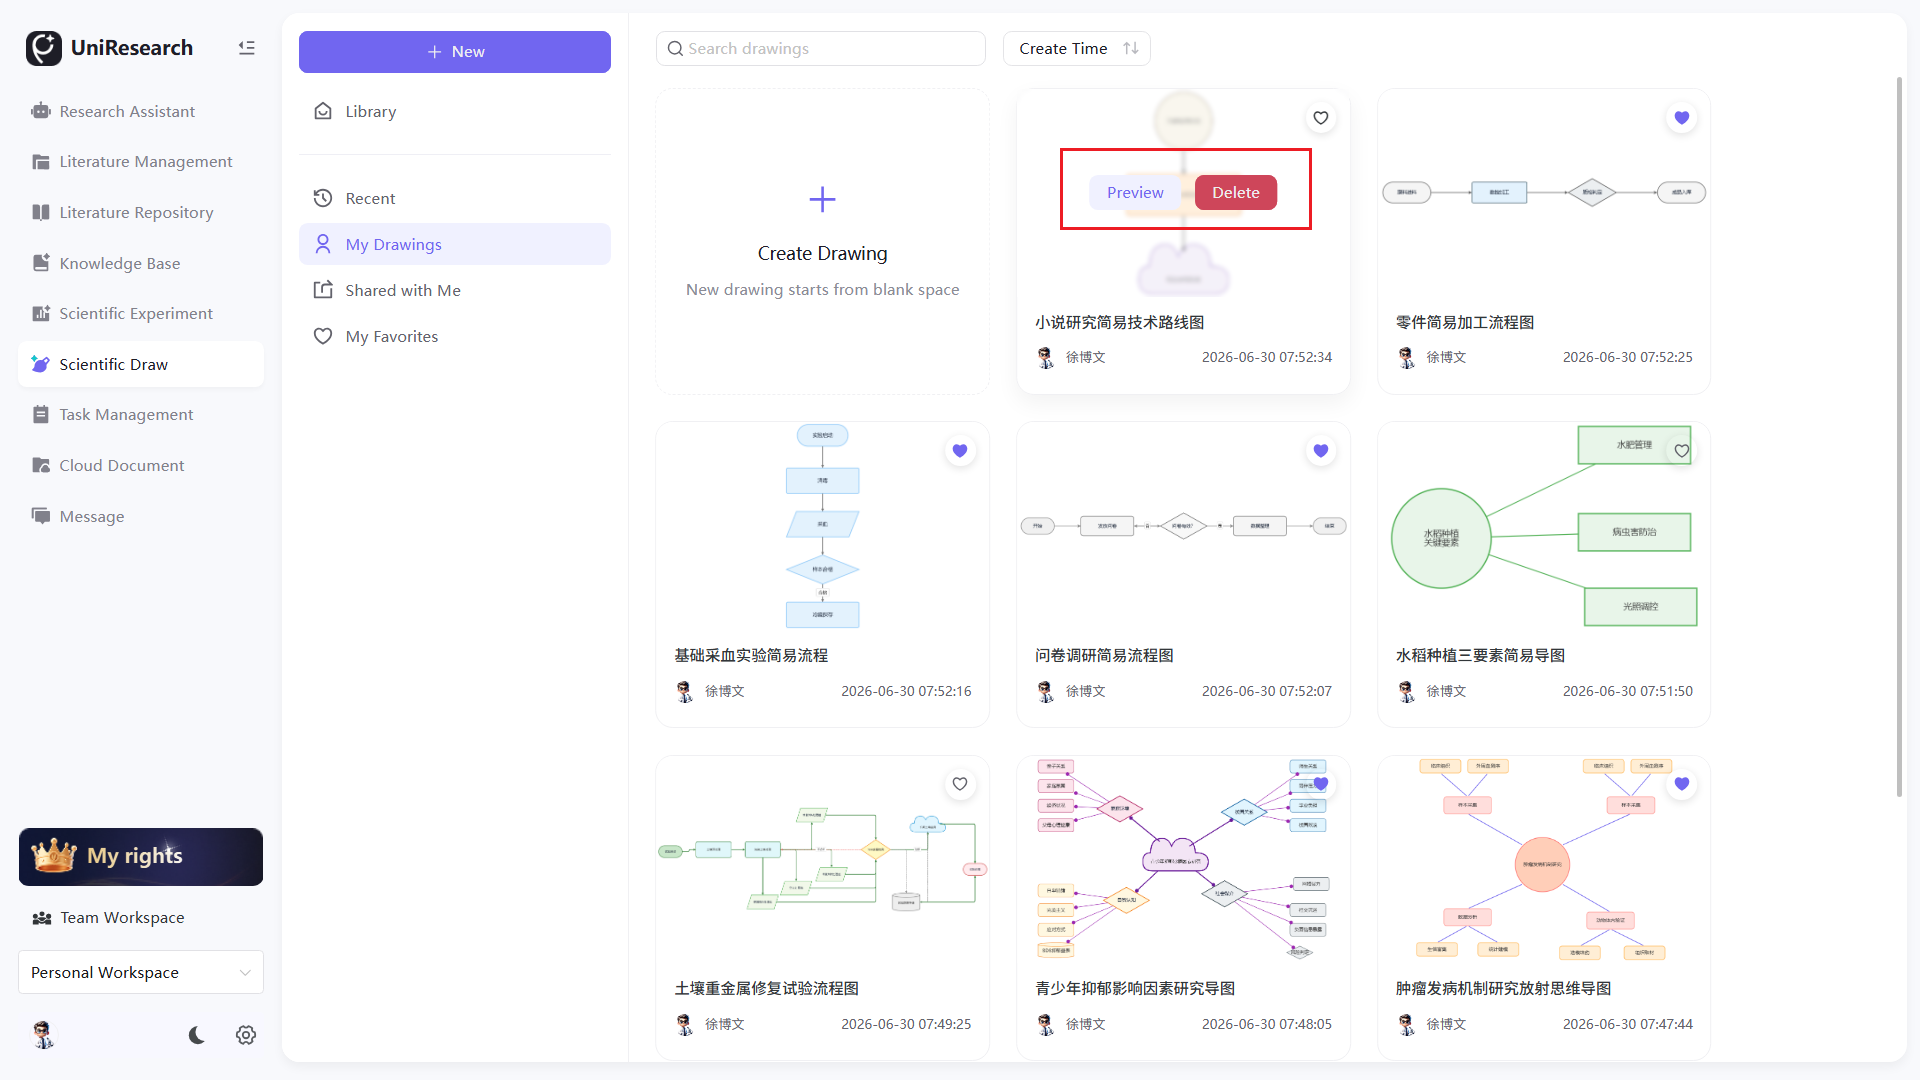
- Mine: Private drawings created by users themselves or generated by copying templates; cards support preview and deletion operations; provides an entrance for creating blank drawings via New Drawing;
- Shared With Me: Drawings shared by others to the current user, only preview viewing is available;
- My Collections: A collection of collected public templates and personal drawings for quick access to commonly used charts.
Create a Blank Drawing
- Two entrances:
- Purple + New button at the top left of the Resource Library page;
- New Drawing card inside the Mine panel;
- Click to directly enter the blank canvas editor, drag graphic materials on the left to complete drawing.
Online Canvas Editing Operations
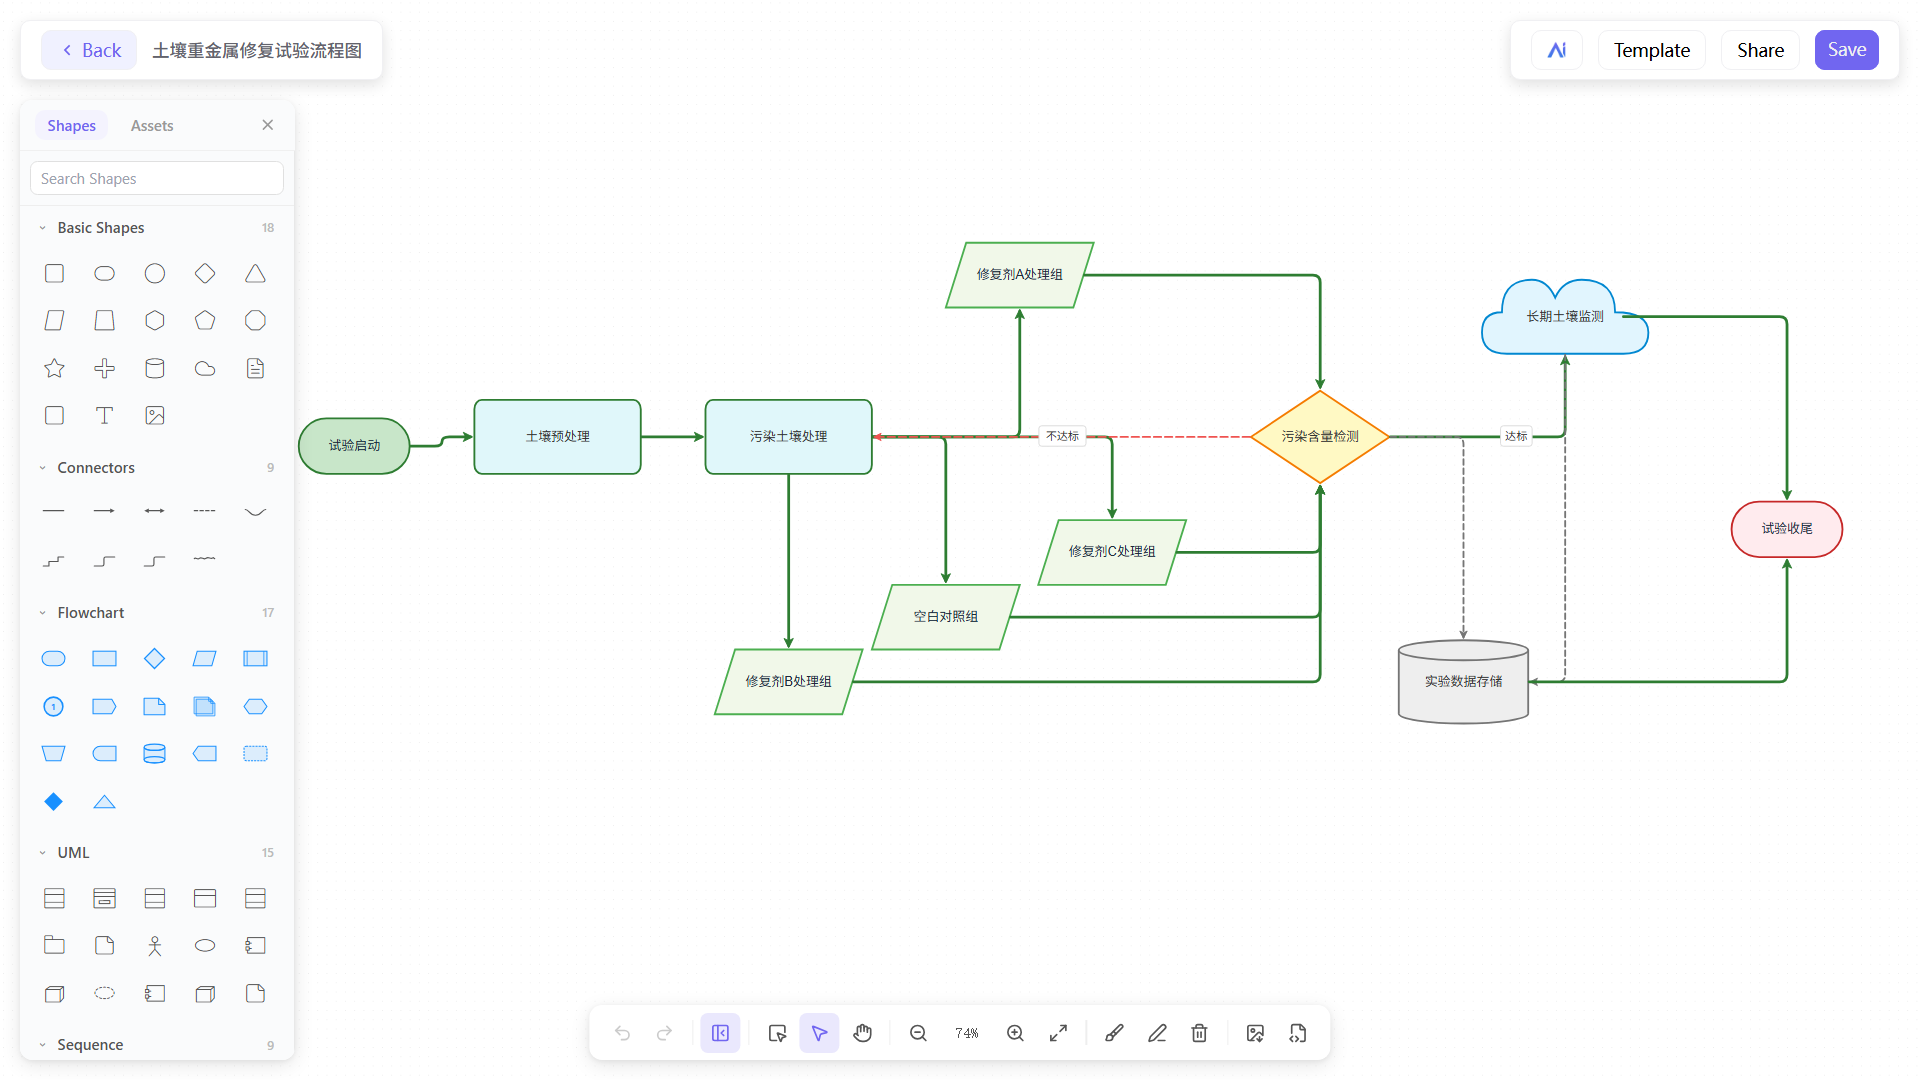
Switch categories on the left material bar: Basic Shapes, Connecting Lines, Flowcharts, Class Diagrams, Sequence Diagrams, drag materials to the canvas.
General editing toolbar at the bottom: Undo, Redo, Multi-select Box, Move, Hand Tool, Hand-drawn Mode, Sketch Mode, Canvas Zoom, Zoom In/Out, Export (png\svg), Delete and other general drawing operations.
Top functional buttons:
- AI: Pop up the AI drawing assistant panel on the right to generate / iterate charts with natural language;
- Template: Quickly apply public templates to overwrite the current canvas;
- Share: Open the pop-up window for sharing permission configuration;
- Save: Real-time save canvas modifications, including AI-generated charts.
Drawing Sharing Configuration
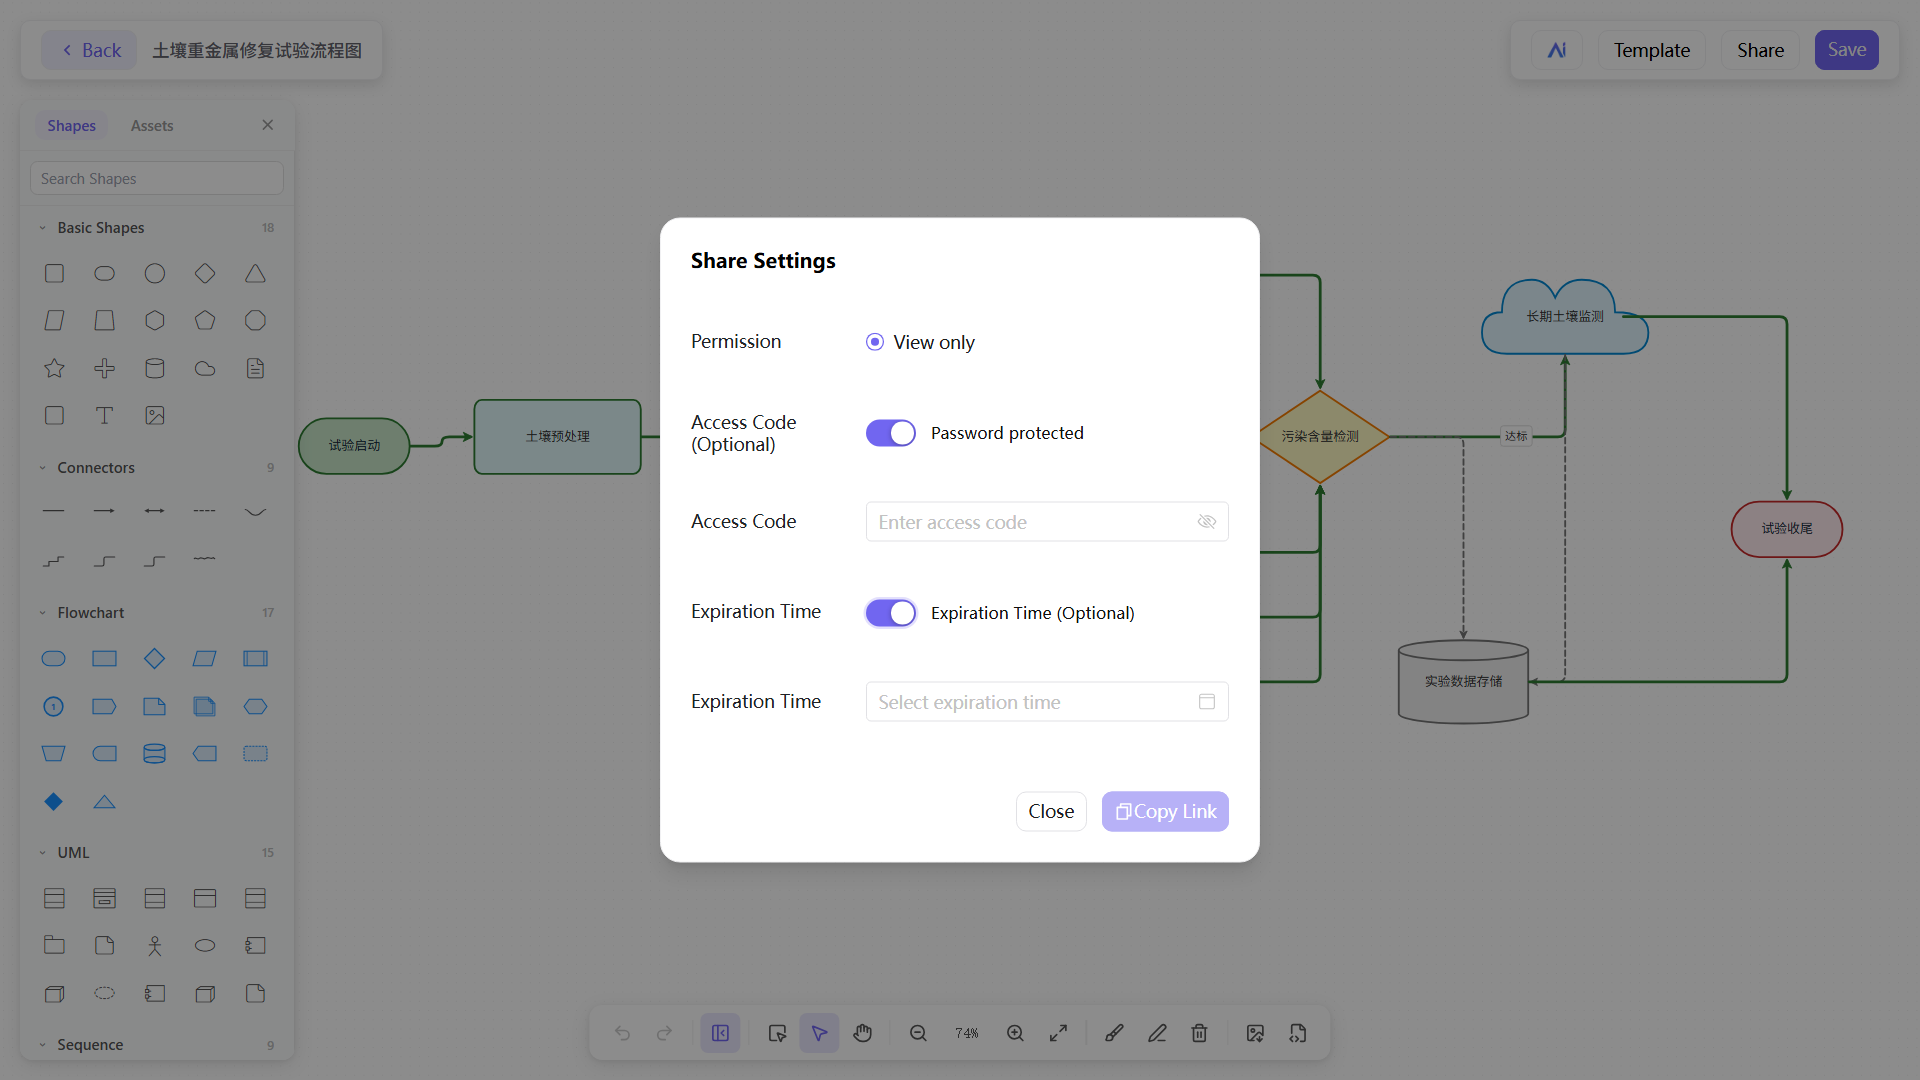
- Click Share at the top right of the editor to pop up the sharing setting panel;
- Access Permission: View Only (read-only permission, no editing allowed);
- Access Code: Enable / disable password verification; if enabled, a password is required to access the link;
- Expiration Time: Permanent Validity / Custom Time Limit;
- Click Copy Link after configuration to distribute to collaborators for viewing.
Manage Drawings in Mine
- Hover the mouse over the drawing card and click Preview to view the complete chart;
- Click Delete, and the drawing will be permanently removed after secondary confirmation with unrecoverable data;
- Click the heart icon to collect the drawing and store it in the My Collections list.
Function Specifications
Classification Navigation Panel
| Category Name | Function Description |
|---|---|
| Resource Library | Platform public academic drawing template library, covering flowcharts, technical roadmaps, Venn diagrams, etc. for all disciplines; supports preview, one-click copy for use and collection |
| Recent Visited | Retain records of recently opened and edited drawings to reduce repeated retrieval |
| Mine | User private drawing warehouse, storing charts created from blank canvases or copied templates; supports creation, preview and deletion management |
| Shared With Me | Drawings shared by other users to the current user, only read-only preview permission available without edit / delete operations |
| My Collections | Uniformly store collected public templates and personal drawings for quick access to commonly used charts |
Template Retrieval & Filtering Functions
- Global Search: Fuzzy match templates by entering keywords of chart names and research fields;
- Discipline Tag Filtering: Filter corresponding professional drawing templates by discipline fields to meet research demands of different disciplines;
- Template Card Metadata: Display chart name, creator, generation time and collection entrance.
Online Drawing Editor
1. Material Resource Bar
- Basic Shapes: General geometric frames such as circles, rectangles, diamonds and triangles;
- Connecting Lines: Straight lines, arrows, dotted lines and bent process connecting lines;
- Flowcharts: Standard research process nodes, start/end frames and judgment frames;
- Class Diagrams: Special graphics for object-oriented academic modeling;
- Sequence Diagrams: Timeline process and interaction node materials;
- Entity-Relationship Diagrams: Special graphics for database / system entities, attributes and association relationships;
- Data Flow Diagrams: Materials for layered data flow, input/output and data storage modules;
- Swimlane Diagrams: Horizontal swimlane process nodes divided by roles / modules for multi-agent collaborative processes;
- State Diagrams: Special graphics for different states, state transitions and trigger conditions of objects.
- Material Library: Real-scene research vector icons, used to add experimental scene visual elements to flowcharts and enrich the intuitiveness of paper illustrations.
2. Top Functional Buttons
| Button | Function Description |
|---|---|
| AI | AI-assisted drawing, automatically generate technical routes, optimize chart layout and supplement research logical structures |
| Template | Quickly access public templates to replace current canvas content with one click |
| Share | Open the pop-up window for sharing permission configuration, set access rules and generate share links |
| Save | Real-time cache all canvas edits to prevent content loss |
3. Bottom Editing Toolbar
Provides general drawing operations including canvas undo, redo, multi-select box, move, hand tool, hand-drawn mode, sketch mode, canvas zoom, zoom in/out, export (png\svg) and delete.
Sharing Permission Configuration
- Access Permission: View Only; recipients cannot edit or modify canvas content;
- Access Password: Optional switch; a password is required to verify access to external links after enabling;
- Expiration Time: Supports permanent validity or custom sharing expiration time;
- Copy Link: One-click copy of the share link for distribution via WeChat, cloud documents or team groups.
Drawing Card Operation Functions
| Operation Item | Function Description |
|---|---|
| Preview | Pop up a full display of the drawing to view detailed layout |
| Use | Copy public templates to personal private warehouse and enter the editor to modify content |
| Collect (Heart Icon) | Add templates / personal drawings to the collection list for unified management of commonly used charts |
| Delete (Personal Drawings Only) | Permanently delete drawing files; canvas content cannot be recovered |
| New Drawing | Open a blank canvas to build scientific illustrations from scratch |
AI Drawing Assistant Function Specifications
Panel Entrance & Layout
- Enter any drawing editing canvas, click the AI button on the top navigation bar, and the AI Drawing Assistant side panel pops up on the right;
- Panel partitions:
- Historical Generation Records Area: Display the last round of AI drawing schemes, generation time and text description of chart structure;
- Thinking Log: Show the reasoning process of AI drawing;
- Input Interaction Box: Text input box at the bottom for entering drawing demand descriptions;
- Model Selection Dropdown: Switch large models for AI drawing;
- Send Button: Submit drawing demands to generate charts.
Core Functional Capabilities
- Generate Complete Scientific Charts via Text Description Users describe drawing requirements (structure, stages, graphic styles, color schemes, discipline purposes) in natural language in the bottom input box, and AI automatically generates the corresponding complete drawing layout to fill the canvas with one click. Sample demand: Vertical three-stage literary research technical roadmap, divided into literature sorting, text analysis and conclusion summary, using circles, rectangles and cloud graphics respectively, light color matching, connected by single arrows.
- Automatic Explanation of Chart Structure After AI generates the chart, it automatically outputs graphic interpretation text: mark the graphic type, color specification, structural logic and applicable scenario of each stage for users to modify and adjust conveniently.
- Multi-round Iterative Optimization of Drawings Supports continuous dialogue modification: additional instructions can be added to adjust layout, replace graphics, modify color schemes, add or delete process branches and switch discipline styles, and AI updates canvas content in real time.
- Visualized Reasoning Process The Thinking area displays the intermediate logic of AI decomposing drawing demands and planning chart structures, helping users understand the generation logic and adjust demands accurately.
Operation Steps (AI Drawing Assistant Usage Process)
- Open the drawing editor and click the top AI button to call up the AI drawing assistant panel on the right;
- Fully describe the drawing requirements in the bottom input box, including: chart type, process stages, graphic styles, color schemes, discipline purposes and layout requirements;
- Click the send button at the bottom right, AI starts generating charts and synchronously outputs structural explanations and thinking logs;
- After generation, the canvas automatically loads the complete chart drawn by AI;
- If adjustment is needed, continue entering modification instructions in the input box (e.g. "Add 1 experimental branch", "Switch all to cool color tones"), and AI iteratively updates the canvas automatically;
- Check the historical records above to reuse previously generated drawing schemes.
Business Rules & Restrictions
- Generation Scope: Only supports built-in platform materials (basic shapes / flowcharts / class diagrams / sequence diagrams), no external custom images will be generated;
- Adaptable Disciplines: Covers scientific charts for all disciplines including Engineering, Science, Medicine, Agriculture, Economics & Management, Literature and Law;
- Hallucination Prevention Mechanism: AI generates strictly according to user input demands and actively prompts unachievable graphics beyond the platform material library;
- Data Storage: AI-generated content is bound to the current drawing canvas synchronously and permanently saved by clicking the Save button;
- Session Isolation: When switching drawing files, the historical records of the AI drawing assistant are independently isolated with the canvas without mutual interference.
Typical Usage Scenarios
- Quickly generate paper technical roadmaps and experimental flowcharts with zero foundation;
- Automatically build chart frameworks according to text descriptions of research topics, eliminating manual drag-and-drop of materials;
- Iteratively optimize existing charts: adjust layout, add or delete process nodes and replace academic color schemes;
- One-click generation of simple logic diagrams for humanities and social sciences, algorithm / experimental structure diagrams for science and engineering.